Abstract
There is a variety of ways to invest in mutual funds. Two of the main traditional ways that most investors rely on are historical returns and analyst’s recommendations. Those mentioned investing ways are not always meeting investor’s expected returns in long terms. This experiment is aiming to advise a set of mutual funds in different classes through processing machine learning. Selected mutual funds are expected to generate the highest 6-month forward returns relative to total return SET index and peers in each asset by 12.83 %
1. Introduction
Relying on traditional investing ways seems to be impossible for investors to meet their financial goals amid the current market environment with high volatility and unexpected events. Over the past few years, investors are more sophisticated and experienced in the financial markets, but it is still not enough to survive and meet their financial goals, especially in this current market situation.
Portfolio Finnomena Best-In-Class (BIC) can help investors select the best mutual in each category of asset class through processing the Random Forests Model (RFM), one of the Machine Learning applications. RFM can screen and select the best mutual funds in different five categories that are expected to generate the highest risk-adjusted returns in six months forward compared to the benchmark and their peers. The inputs of processing RFM model include economic data, mutual fund’s return seasonality, applied-mathematic data, technical indicator, and the views from fund managers and analysts. RFM model will run all of the variables and determine which one is statistically significant to forecast BIC’s return. This will benefit us to improve the efficiency of BICs model in the future.
2.Data and Methodology
2.1 Data Source
The inputs of processing RFM include daily 20-year historical returns of Equity Thai Active Large-Cap, technical indicators, views from fund managers and analysts, applied-mathematic data, and NAV of each mutual fund. RFM model can determine which variables are statistically significant to forecast returns of BICs. Hence, it can select the inputs that are significant to the model, which will enhance the accuracy of our models to select the best possible mutual funds in each asset class. The criteria of input selection are that it is widely known by local investors and enough number of mutual funds in Equity Thai Active Large-Cap.
2.2 Portfolio Construction Method
The portfolio will select the top three mutual funds with the highest score through running BICs models every six months
2.3 Experiment Setup
In this experiment, we set the definition of the best portfolio to be the one that generates the maximum alpha in a given period.
α = ReturnPortfolio – ReturnBenchmark
However, instead of using market return as a benchmark, in this experiment, we use the average return of mutual funds within the same category served as benchmark return to enhance our precision. Next, we evaluate the strategy based on the alpha that the portfolio generated at the end of each of the given periods. The invested period is set to be 6 months, meaning that each of the constructed portfolios will be invested for 6 months and the generated return during that period will be evaluated against the mutual funds’ return in the same category at the end of the 6th month
3. Model Architecture
Apart from quantitative data, this experiment also relies on views from our investment team who have experienced and specialized in selecting mutual funds. With the combination of quantitative and qualitative data, it enhances the confidence level of the model to select the mutual funds that can achieve the 6-month highest possible return relative to peers in each category.
3.1 Random forests Model [1]
Significant improvements in classification accuracy have resulted from growing an ensemble of trees and letting them vote for the most popular class. To grow these ensembles, often random vectors are generated that govern the growth of each tree in the ensemble. (Leo Breiman, 2001)
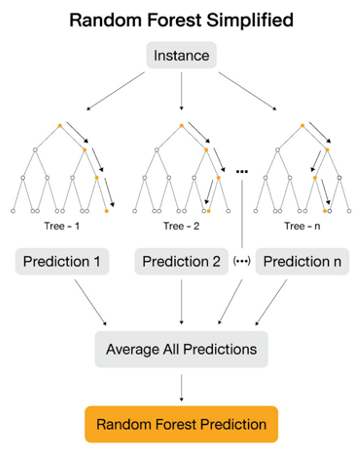
Figure 1. Random Forests Model
3.2 Best In Class Model
BIC portfolio with RFM can select a set of mutual funds in each category, which is expected to achieve the highest possible alpha (the difference of returns between selected mutual funds and peers in the same category. Through processing Ensemble Learning, the model creates additional trees, and then the model will select the tree with the largest number of votes from every tree. Sequentially, the model will rank the score of mutual funds based on results of RFM to create BICs portfolios

Figure 2. Best-In-Class architecture
4. Best In Class Portfolio
After we got the score for each mutual fund from the model in Sec. xx, we then allocate the 3 highest scored mutual funds at 40%, 30%, and 30% to form a Best in Class Portfolio based on the chosen category. The portfolio is then adjusted and rebalanced every 6 months to ensure the performance as we have shown in Sec. xx, that the historically performed mutual funds do not necessarily excel in the future. Please note that each Best In Class Portfolio used a specific model that was trained on the delegated category.
4.1 Best In Class Experiment Results
From the result of the experiment, the selected mutual fund (BICs) in Equity Large Cap outperformed the peer’s average 2-year returns. Apart from the returns, selected mutual funds outperform peers in metrics such as alpha ratio by 12.83% and lower maximum drawdown by 4.56 %
4.2 Trading Simulation
Performance evaluation of the BICS model rebalanced the portfolio every 6 months under the real-world scenario while holding the switching period to be T+3, transaction fee to be at 0.5% for both buy and sell as well as 1% for each complete transaction. From the chart below, it represents the returns of BICs performance relative to benchmark SET TRI
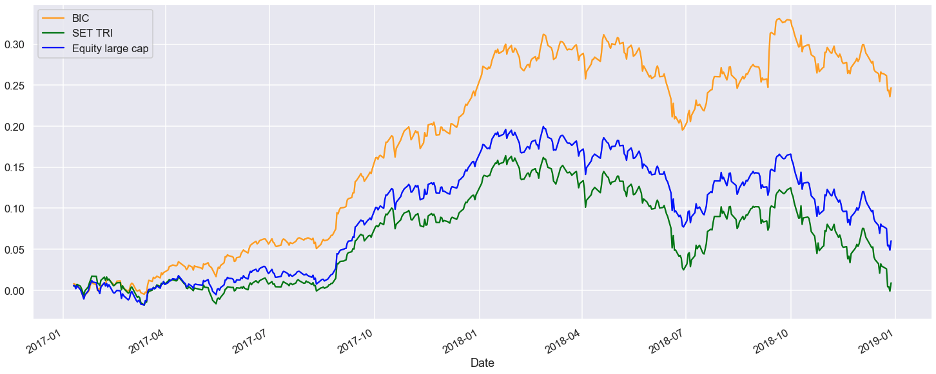
Figure 3. A Balanced BIC Portfolio Strategy
40% 1st pick, 30% 2nd pick, 30% 3rd pick
Bull Market Environment
During the bull market environment, given rebalancing the portfolio every six months during 2017-2018, BICs portfolio’s net-of-fee return is 28.14 % while the benchmark SET TRI return is 12.14 %. The BICs model has a positive alpha ratio of 16 %.
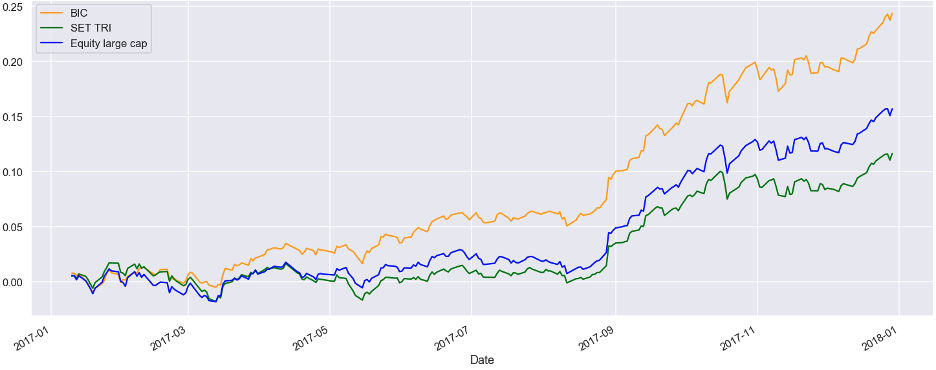
Figure 4. A BIC Portfolio Strategy in Bull Market
Bear Market Environment
During the bear market environment ranging from 2018-2019 , BICs still outperformed SET TRI return. it has a smaller maximum drawdown of -11.24 % while SET TRI has -15.8 % The performance comparison has been shown below.
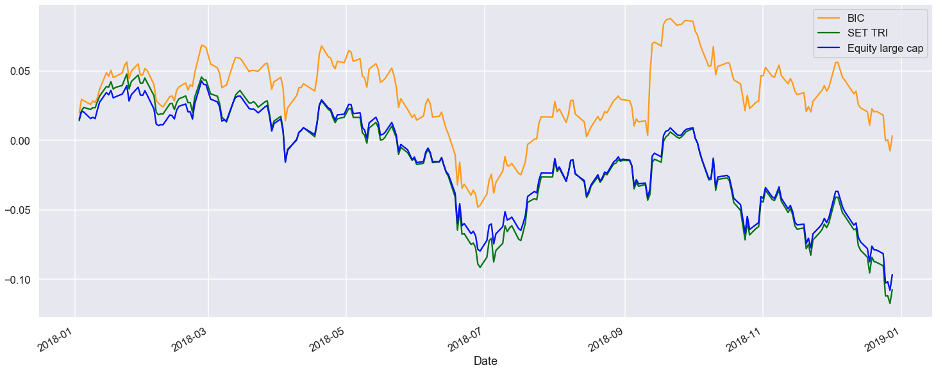
Figure 5. A BIC Portfolio Strategy in Bear Market
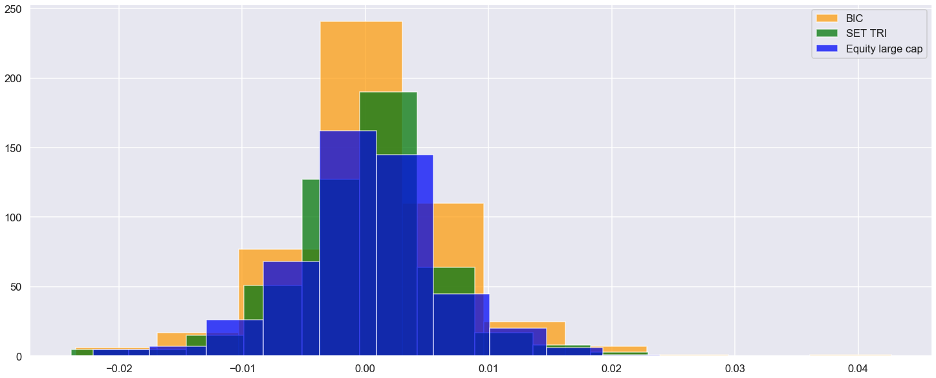
Figure 6. Historical returns from Strategies
5. Conclusion
The experiment proposes an alternative way to select mutual funds through processing Random Forests Model, one of the machine learning model types. Based on the back-testing result, it has been found that the BICs portfolio significantly outperforms the benchmark in different market scenarios. Apart from quantitative metrics used in the model, we also evaluate the fund manager’s performance over time as a part of BICs’ score. Overall, we found this model to be well-suited for assisting individual investors to construct their portfolio
References
- LEO BREIMAN., Machine Learning, 45, 5–32, 2001 c 2001 Kluwer Academic Publishers. Manufactured in The Netherlands.
- Thomas G Dietterich., Ensemble Methods in Machine Learning, 2000, Oregon State University Corvallis Oregon USA.
บทเกริ่นนำ
การลงทุนในกองทุนรวมถือว่าทำได้หลากหลายวิธี ในขณะที่วิธีการใช้ผลตอบแทนย้อนหลังและคำแนะนำจากผู้เชี่ยวชาญประกอบควบคู่กันไป เป็นวิธีที่นักลงทุนเลือกใช้กันมากที่สุด อย่างไรก็ตามในระยะยาวการลงทุนด้วยวิธีดังกล่าวไม่สามารถตอบโจทย์ความคาดหวังของนักลงทุนไปได้ตลอด เพราะ กลยุทธ์การลงทุนแบบดั้งเดิมนั้นบรรลุเป้าหมายทางการเงินได้ยาก จากภาวะการลงทุนที่คาดการณ์ได้ยากและมีความผันผวนสูง ณ ปัจจุบัน ถึงแม้ในช่วงไม่กี่ปีที่ผ่านมา นักลงทุนจะเข้าถึงข้อมูลและมีความเชี่ยวชาญในตลาดการเงินมากขึ้นก็ตาม
จุดมุ่งหมายของบทความนี้จึงเป็นการแสดงการแนะนำกองทุน ผ่านการใช้การเรียนรู้ของเครื่อง (Machine learning) และ โมเดลโครงข่ายประสาทเทียม (Neural Network Model) เพื่อทดสอบผ่านกองทุนจำนวนหนึ่งที่มีสินทรัพย์หลากหลายประเภท โดยกองทุนที่ถูกคัดเลือกในแต่ละสินทรัพย์นั้นมีผลตอบแทนที่คาดการณ์ใน 6 เดือนข้างหน้าสูงที่สุด เทียบกับผลตอบแทนทั้งหมดจาก SET Index และ ที่ได้จากกองทุนโดยสมาคมบริษัทจัดการลงทุน (AIMC) และกลุ่มอื่น ๆ ที่มีความใกล้เคียงกัน
- แนะนำโมเดลวิเคราะห์พอร์ต
พอร์ต FINNOMENA Best-In-Class (BIC) จะช่วยคัดสรรกองทุนที่ดีที่สุดในแต่ละประเภทสินทรัพย์ โดยนำ Machine learning เข้ามาช่วยเลือกกองทุน ซึ่งข้อดีของ Machine Learning คือระบบคอมพิวเตอร์นี้สามารถเรียนรู้ได้ด้วยตนเอง ผ่านข้อมูลต่าง ๆ ที่มนุษย์ป้อนเข้ามา เพื่อผลิตผลลัพธ์ที่แม่นยำ ข้อดีของมันคือมันสามารถเรียนรู้กี่ครั้งก็ได้ไม่จำกัดจำนวนจนกว่าจะเจอผลลัพธ์ที่ดีที่สุด เมื่อเปรียบเทียบกับมนุษย์แล้ว การใช้ Machine Learning จะช่วยประหยัดเวลา และลด Human Error ไปได้มากกว่า
FINNOMENA เลือกใช้ machine learning กับโมเดลยอดนิยมที่มีชื่อว่า the Random Forests Model (RFM) RFM สามารถช่วยคัดออกและเลือกสรรกองทุนที่ดีที่สุดในแต่ละหมวดสินทรัพย์ (Asset Class) ที่คาดหวังว่าจะทำผลงานเมื่อเทียบกับความเสี่ยงได้สูงสุดในกรอบเวลา6เดือนข้างหน้าเปรียบเทียบกับเกณฑ์ที่ใช้ (Benchmark) และกลุ่มอื่น ๆ ที่มีความใกล้เคียงกัน
ปัจจัยที่นำมาประมวลผลบนโมเดล RFM ประกอบไปด้วยข้อมูลทางเศรษฐกิจ (economic data), นำผลตอบแทนของกองทุนตามฤดูกาล (mutual fund’s return seasonality) การประยุกต์ข้อมูลทางคณิตศาสตร์ (applied-mathematic data) เครื่องมือวิเคราะห์ทางเทคนิค (technical indicator) ความเห็นของผู้จัดการกองทุนและนักวิเคราะห์( views from fund managers and analysts )และ NAV ของแต่ละกองทุน มาประกอบเข้าด้วยกันเพื่อคัดเลือกกองทุนที่ดีที่สุดเพื่อนำไปเพิ่มประสิทธิผลของการลงทุนใน BIC Model
- การคัดเลือกและนำข้อมูล (Data) มาใช้
ขอนำตัวอย่างผลการทดลองมาให้ดูอันหนึ่ง เป็นการคัดเลือกกองทุนหุ้นไทยขนาดใหญ่ (Equity Large-Cap) ข้อมูลที่โมเดลนำมาประมวลผล ได้แก่ 1) ผลตอบแทนย้อนหลัง 20 ปี นับแบบวันต่อวัน ของหุ้นไทยขนาดใหญ่ 2) ปัจจัยทางเทคนิค 3) มุมมองจากผู้จัดการกองทุนและนักวิเคราะห์ 4) ข้อมูลเชิงคณิตศาสตร์ประยุกต์ และ 5) NAV ของแต่ละกองทุน แบบวันต่อวัน โดยกรอบเวลาของการประวลผลอยู่ที่ทุก ๆ 6 เดือนภายใต้สถานการณ์โลกที่เกิดขึ้นจริง และมีการคิดค่าธรรมเนียมเข้าไปแล้ว
ซึ่งโมเดล RFM สามารถตัดสินใจได้ว่าตัวแปรไหนบ้างมีความสำคัญทางสถิติที่จะคาดการณ์ผลตอบแทนของพอร์ต BIC ได้ ดังนั้นโมเดลRFMจะช่วยเลือกปัจจัยและตัวแปรที่เหมาะสมกับพอร์ตที่จะส่งเสริมความแม่นยำของBIC model ในการเลือกกองทุนได้ถูกต้องในแต่ละประเภทสินทรัพย์ โดยการเลือกนี้จะนำไปใช้กับกองทุนประภทหุ้นไทยขนาดใหญ่ (Equity Large-Cap)ที่มีขายอยู่ในตลาดประทเศไทยเพื่อสามารถนำผลลัพธ์จากโมเดลไปประยุกต์ใช้ได้จริง
2.2 โครงสร้างของพอร์ตการลงทุน
กองทุนที่มีคะแนนสูงที่สุด 3 อันดับแรก จะถูกนำมาใส่ในพอร์ตการลงทุนและโมเดลดังกล่าวจะมีการทดสอบทุก ๆ 6 เดือน เพื่อให้แน่ใจว่ากองทุนทุกกองยังเป็นกองทุนที่ดีที่สุดอยู่เสมอ
2.3 การทดสอบสมมติฐาน
ในการทดสอบ เราใช้ อัลฟ่า (Alpha) หรือ ผลตอบแทนเหนือค่าเฉลี่ย เป็นคำจำกัดความของพอร์ตการลงทุนที่ดีที่สุด โดยพอร์ตที่ให้อัลฟ่าสูงที่สุดในกรอบเวลาที่กำหนด จะถือว่าเป็นพอร์ตการลงทุนที่ดีที่สุด
α = ReturnPortfolio – ReturnBenchmark
ในส่วนของเกณฑ์เทียบเคียง (Benchmark) เราใช้ผลตอบแทนเฉลี่ยของกองทุนที่อยู่ในหมวดหมู่เดียวกันเป็นตัวชี้วัดเพื่อเพิ่มความแม่นยำสำหรับการทดสอบนี้โดยกระบวนการที่ว่าจะประเมินผ่าน อัลฟ่า (Alpha) ที่ถูกสร้างในแต่ละพอร์ตการลงทุนในช่วงเวลาที่แตกต่าง โดยมีระยะเวลาการลงทุนกำหนดที่ 6 เดือน ซึ่งหมายความว่าพอร์ตการลงทุนจะเสมือนการลงทุนในอีก 6 เดือนข้างหน้า และจะถูกนำมาเทียบผลตอบแทนของกองทุนในหมวดหมู่เดียวกัน
- โครงสร้างของโมเดลการทำนาย
นอกจากข้อมูลทางสถิติแล้วนั้น การทดสอบครั้งนี้ยังเปิดให้นำข้อมูลมุมมองการลงทุนจากทีม Investment ผู้ซึ่งมีประสบการณ์และความเชี่ยวชาญเฉพาะในการเลือกกองทุนรวมที่ดีมาประกอบ ด้วยการประเมินควบคู่กันทั้งปัจจัยคุณภาพ quantitative และปริมาณ qualitative ระดับความเชื่อมั่นของโมเดลและการเลือกกองทุนรวมที่ดีจะมีแนวโน้มที่จะสามารถสร้างโอกาสได้ผลตอบแทนเฉลี่ย 6 เดือนสูงสุดเมื่อเทียบกับกองทุนกลุ่มอื่น ๆ ที่มีความใกล้เคียงกัน (peers)
3.1 โมเดล Random forests Model (RFM)
การจัดหมวดหมู่จะมีความแม่นยำมากยิ่งขึ้นตามการเติบโตของสาขา (Tress) ซึ่งจะถูกนำไปโหวตหมวดหมู่ที่ได้รับความนิยมสูงที่สุด โดยการเติบโตดังกล่าว ลูกศรสมมติแบบสุ่ม (Vectors) จะถูกสร้างขึ้นบ่อยครั้งและจะนำไปกำหนดการเเตกสาขาของแต่ละสาขา
Figure 1. Random Forests Model
3.2 Best-in-Class โมเดลที่เลือกกองทุนที่ดีที่สุดให้กับนักลงทุน
โมเดลแบบผสม (Ensemble Model) จะช่วยเลือกกองทุนจำนวนหนึ่งที่มีแนวโน้มในการสร้างค่าอัลฟ่าได้สูงที่สุด (ส่วนต่างระหว่างผลตอบแทนของกองทุนที่ถูกเลือกและกองทุนในหมวดหมู่เดียวกัน) ซึ่ง โมเดลการเรียนรู้แบบผสม (Ensemble learning model) จะเลือกโมเดลที่ได้รับการโหวตมากที่สุด และนำผลลัพธ์ที่ได้ ไปให้กับโมเดลโครงข่ายประสาทเทียม (Neural Model) เพื่อคาดการณ์ผลตอบแทนในช่วง 6 เดือนข้างหน้า และนำไปสร้างพอร์ตBICต่อไปผ่านการใช้โมเดลเครือข่ายประสาทเทียมในการจัดอันดับคะแนนของกองทุนตามลำดับ
Figure 2. Best-In-Class architecture
- การจัดสัดส่วนพอร์ต Best-in-Class
หลังจากได้คะแนนของแต่ละกองทุนจากโมเดลเป็นที่เรียบร้อย เราจะทำการแบ่งสัดส่วนที่ 40%, 30% และ 30% ตามลำดับ เพื่อสร้างพอร์ตการลงทุน ซึ่งพอร์ตจะมีการอัปเดตและปรับสัดส่วนทุก 6 เดือน เพราะ กองทุนที่ทำผลงานได้ดีในอดีตไม่ได้หมายความว่าจะทำผลตอบแทนได้ดีในอนาคตจุดสำคัญเพิ่มเติมก็คือ พอร์ต BIC แต่ละพอร์ตใช้โมเดลที่ถูกฝึกฝนในรูปแบบที่แตกต่างกันตามแต่หมวดหมู่
4.1 ผลการทดลองกับโมเดล Best In Class
จากผลการทดลองดังกล่าว กองทุนที่ได้รับคัดเลือกเข้า BIC ในหมวดหุ้นไทยขนาดใหญ่นั้นสามารถเอาชนะผลตอบแทนเฉลี่ย 2 ปีของกองทุนประเภทเดียวกัน รวมถึงชนะในเกณฑ์อื่น ๆ เช่น Alpha Ratio ซึ่งก็คือส่วนต่างระหว่างผลตอบแทนของกองทุนกับเกณฑ์มาตรฐาน (ชนะไป 12.83%) และมี Max Drawdown ที่ต่ำกว่ากองอื่น ๆ อยู่ 4.56%
4.2 สมมุติฐานการปรับพอร์ต (trading)
ผลตอบแทนของพอร์ต BIC ที่มีการปรับสัดส่วนทุก 6 เดือน ภายใต้เงื่อนไขตามความเป็นจริง ที่มีระยะเวลาในการสับเปลี่ยนกองทุนที่ T+3 และค่าธรรมเนียมที่ 05% ทั้งในส่วนของการซื้อและขาย และ 1% หลังการซื้อขายสำเร็จ พอร์ต BIC สามารถสร้างผลตอบแทนที่เหนือกว่าเกณฑ์เทียบเคียงอย่างกองทุนในหมวดหมู่ benchmark SET TRI (ดูรูปประกอบ)
Figure 3. A Balanced BIC Portfolio Strategy
40% 1st pick, 30% 2nd pick, 30% 3rd pick
สมมุติฐานตลาดกระทิง
ในช่วงตลาดกระทิง บนสมมุติฐานว่ามีการปรับพอร์ตทุก 6 เดือนช่วงปี 2017-2018 ผลตอบแทนหักค่าธรรมเนียมของพอร์ต BIC อยู่ที่ 28.14% ขณะที่ SET TRI อยู่ที่ 12.14% ทำให้มี Alpha Ratio ที่ 16%
Figure 4. A BIC Portfolio Strategy in Bull Market
สมมุติฐานตลาดหมี
ปี 2018-2019 BIC ก็ยังสามารถเอาชนะ SET TRI ได้ โดยมี Max Drawdown อยู่ที่ -11.24% ขณะที่ SET TRI อยู่ที่ -15.8%
Figure 5. A BIC Portfolio Strategy in Bear Market
ที่น่าสนใจคือ พอร์ต BIC มีผลงานโดดเด่นทั้งในสภาวะตลาดกระทิงและตลาดหมี
Figure 6. Historical returns from Strategies
- สรุปจุดเด่นของพอร์ต Best-in-Class (BIC)
พอร์ต Best-in-Class (BIC) ที่ใช้โมเดล Random Forests Model (RFM) หนึ่งในโมเดลที่นิยมของการทำ Machine learning ถือเป็นอีกหนึ่งทางเลือกสำหรับนักลงทุนที่ต้องการความมั่นใจว่ากองทุนที่ถือนั้นเป็นกองทุนที่ดีที่สุดแล้วในประเภทนั้น ๆ เพราะจากการทดลองในบทความฉบับนี้ผลลัพธ์ได้แสดงให้เห็นว่า BIC โมเดลและพอร์ตลงทุนนั้นเอาชนะเกณฑ์เทียบเคียง (Benchmark)โดยทาง FINNOMENA จะมีการปรับพอร์ตทุก ๆ 6 เดือน เพราะเจอว่า 6 เดือนคือระยะเวลาที่สมดุลที่สุด ระหว่างผลตอบแทนของกองทุนและค่าธรรมเนียมที่เกิดขึ้นและด้วยความที่พอร์ต Best-in-Class แยกเป็นประเภทสินทรัพย์ จึงเหมาะกับนักลงทุนที่ต้องการกระจายความเสี่ยง รวมถึงต้องการมั่นใจว่าแต่ละประเภทสินทรัพย์ที่กระจายลงทุนนั้น ได้ลงทุนผ่านกองทุนที่ดีที่สุดของประเภทนั้น ๆ แล้ว
- ขอบเขตและข้อจำกัดของโมเดล
- การทำนายผลของโมเดลอาจคลาดเคลื่อนกับสภาวะของตลาดในอนาคตได้
- การเรียนรู้ของโมเดลครอบคลุมช่วงระยะเวลา 10 ปีย้อนหลัง อาจไม่ครอบคลุมกับเหตุการณ์ที่จะเกิดในอนาคตอย่างมีนัยสำคัญได้
- ผลการทำนายอยู่บนช่วงระยะเวลา 6 เดือนหลังจากประกาศเท่านั้น และจะมีการปรับทุก 6 เดือน
References
- LEO BREIMAN., Machine Learning, 45, 5–32, 2001 c 2001 Kluwer Academic Publishers. Manufactured in The Netherlands.
- Thomas G Dietterich., Ensemble Methods in Machine Learning, 2000, Oregon State University Corvallis Oregon USA.